
After its post-COVID surge, the staffing industry declined for three years in a row before returning to growth in 2026. US staffing revenue grew a median 5% year over year in April, its fastest rate in three years. That is why, today, agencies need to innovate and adapt to sustain the business.
In this article, we’ll look at the main staffing industry trends that will determine the sector’s future. You’ll check the state of the market, employees, and the challenges that agencies are currently working with. So, let’s get started!
Before you get into the full list, here are the most notable staffing industry statistics to review:
In 2024, the staffing industry’s revenue worldwide was about $620 billion, and it declined another 3% in 2025 to roughly $600 billion. After three consecutive years of decline, the market returned to growth in 2026.
US staffing revenue grew a median 5% year over year in April, the highest rate in three years, and no segment was declining. Based on the SIA staffing forecast, total US staffing will grow about 1% in 2026 and 2% in 2027, so the recovery is steady but moderate.
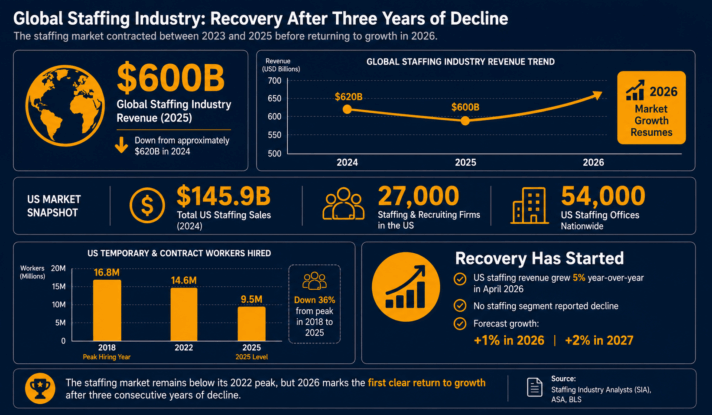
The United States generates over a quarter of the sector’s revenue. Today, there are 27,000 staffing and recruiting companies in the US alone, operating around 54,000 offices. Their earnings hit $159.1 billion. Forecasts say the US staffing market will grow 1.3% in 2024 and 2.1% in 2025. US temporary and contract staffing sales were $124.0 billion in 2024, down from a peak of $159.1 billion in 2022, and total US staffing sales (including search and placement) came to $145.9 billion.
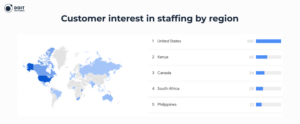
Besides leading by revenue, the United States has the highest interest rate in staffing. The top 5 also include Kenya, Canada, South Africa, and the Philippines.
US staffing companies hired around 9.5 million temporary and contract workers in 2025, down from 14.6 million in 2022. The peak over the past 10 years was in 2018, with 16.8 million people hired. According to this indicator, the US is second after China, with 21 million staffing workers on average per year.
Here is the number of temporary and contract staffing employment in the US in recent years:
2016
14.5
-
2017
15.5
↑ 6.9%
2018
16.8
↑ 8.4%
2019
16
↓ 4.76%
2020
13.6
↓ 15%
2021
14.1
↑ 3.68%
2022
14.6
↑ 3.55%
2023
12.7
↓ 13.0%
2024
11.2
↓ 11.8%
In total, the staffing industry employs about 1.57% of the US nonfarm labor force as of May 2025, down from a record 2.1% in March 2022. For comparison, the staffing agency penetration rate in Europe is 1.37%, and in the Asia-Pacific region, it is 2.17%. The highest value ( >3%) is in the Netherlands and the UK.
Now, let’s look at the demographics of employees working through staffing agencies. In this section, we will review their occupations, average rates in the US, and the staffing industry trends by sector.
Today, around 36% of staffing specialists work in high-skilled fields. Among them, 17.3% are in professional management, 10.2% in healthcare, and 8.4% in engineering, IT, and science. Such roles often require specialized education and pay above average.
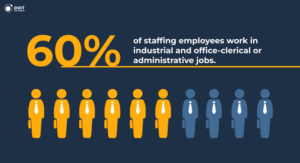
Also, the remaining share works in industrial and office-clerical or administrative jobs, with industrial alone making up 54.7% of staffing employment. Here are some insights:
Let’s analyze the staffing data in detail by job demand and salary.
Almost 2.6 million temporary and contract employees work for US staffing companies during an average week. According to the Bureau of Labor Statistics, as of May 2025, there were 2,593,250 temporary employment positions, down from 2,964,020 in 2023.
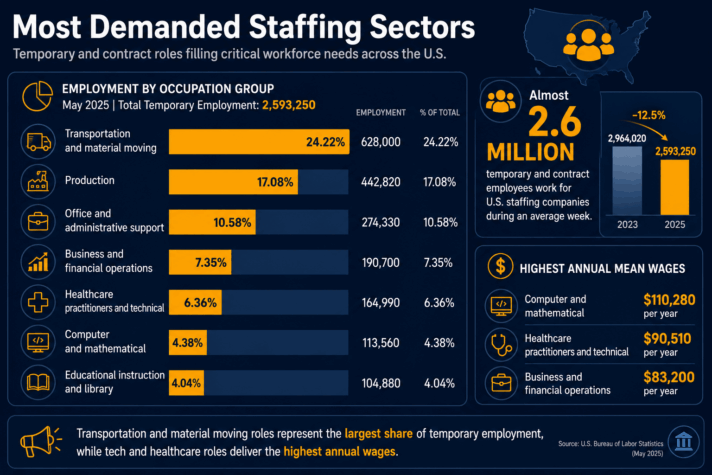
Transportation and material moving occupations accounted for 24.22% of the total. The next most popular were production (17.08%) and office and administrative support roles (10.58%).
Here is a breakdown of staffing industry trends by occupation employment:
Transportation and material moving
628,000
24.22%
$17.64
$36,690
Production
442,820
17.08%
$18.72
$38,950
Office and administrative support
274,330
10.58%
$22.00
$45,760
Business and financial operations
190,700
7.35%
$40.00
$83,200
Healthcare practitioners and technical
164,990
6.36%
$43.51
$90,510
Computer and mathematical
113,560
4.38%
$53.02
$110,280
Educational instruction and library
104,880
4.04%
$20.61
$42,860
Construction and extraction
102,030
3.93%
$23.09
$48,040
Building and grounds cleaning
94,860
3.66%
$17.47
$36,340
Healthcare support
86,180
3.32%
$22.44
$46,660
Sales and related
62,740
2.42%
$28.06
$58,360
Food preparation and serving
60,960
2.35%
$18.61
$38,710
Management
57,190
2.21%
$67.88
$141,180
Installation, maintenance, and repair
56,750
2.19%
$24.33
$50,610
Architecture and engineering
30,710
1.18%
$51.33
$106,770
Arts, design, entertainment, sports, and media
24,000
0.93%
$45.17
$93,940
Personal care
23,260
0.90%
$18.17
$37,790
Life, physical, and social science
16,640
0.64%
$39.26
$81,660
Community and social service
11,510
0.44%
$30.42
$63,270
All occupations
2,593,250
100%
$26.11
$54,310
The highest-cost expert group hired through staffing companies is management, with an annual average salary of $141,180. Here, chief executives receive over $235,520 per year, architectural and engineering managers – $216,350, and PR managers – $174,160.
The second high-paid sector is computer and mathematical roles, with an average salary of $110,280 per year. So, if you want to hire computer and information research scientists, expect to pay $150,680 per year, database architects – $146,550, and software developers – $147,210.
On average, computer and mathematical roles in staffing pay $110,280 annually per employee in the US. Here is a detailed overview.
Computer programmers
Create, modify, and test the code and scripts that allow computer applications to run.
$62.54
$130,070
Software developers
Research, design, and develop computer and network software or specialized utility programs.
$70.78
$147,210
Software QA analysts and testers
Develop and execute software tests to identify software problems and their causes.
$49.27
$102,480
Web developers
Develop and implement websites, web applications, app databases, and interactive web interfaces.
$58.66
$122,020
Web and digital interface designers
Design digital user interfaces or websites.
$59.89
$124,570
IT staffing usually recovers first and pays the most, so it is worth a closer look. Globally, the IT staffing market was worth about $123.3 billion in 2025, and it is on track for $127.75 billion in 2026, on the way to $152.47 billion by 2031. North America makes up about 44% of that.
In the US, IT staffing revenue should grow about 1% in 2026 after two down years. Overall IT headcount looks flat, up just 0.57% over the past year, but that figure hides a clear split.
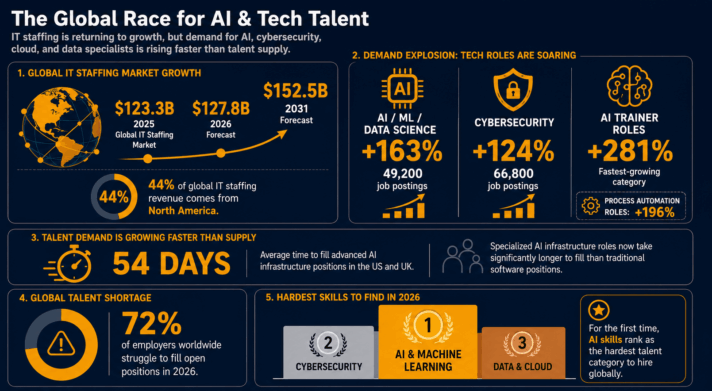
Most of the demand is going into cloud, cybersecurity, data, and AI roles, while other roles stay flat. Here is how fast demand for tech roles is rising, and how long the hardest ones take to fill:
The shortage is global. 72% of employers worldwide report trouble filling roles in 2026, and for the first time, AI skills are the hardest to find of any category.
Specialized roles like these are where a staffing partner makes the biggest difference. At DOIT, we provide the first vetted profiles within 3 to 5 business days for common stacks, which shortens a two-month search to about a week.
Now, let’s move on to the staffing industry trends that are shaping the sector in 2026. In this section, we’ll focus on the shifts in hiring, technology, pay, and competition that agencies are working with right now.
For years, a tight talent pool was the main challenge in staffing. In 2026, that changed. When agencies named their main problem this year, 31% pointed to soft demand and winning clients, while only 12% pointed to talent scarcity.
A few years ago, staffing agencies struggled to find enough candidates. Now they struggle to find enough clients. Most are still optimistic: nearly 70% of the agencies that lost revenue in 2025 expect to grow in 2026. In 2026, the harder job is winning new business.
AI is the clearest dividing line between staffing agencies this year. Almost half of them, 46%, still use no AI at all, while only 10% run it across their full workflow. About 30% have started using agentic AI, and another 29% use basic generative tools.
The agencies that use AI grew faster. They were 3.5 to 4.5 times more likely to have grown revenue in 2025, and 78% of high-growth agencies run AI inside their applicant tracking system. Among those that added AI screening, 55% say it improved their hiring results by more than a quarter, and 46% cut their screening time in half.
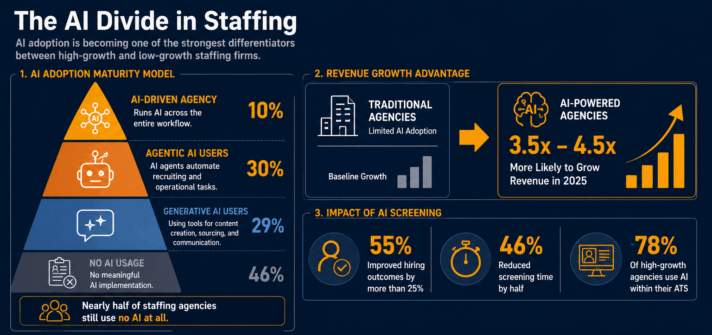
Here are the AI tasks most tied to faster growth:
Today, 39% of agencies rank AI and automation as their top digital transformation priority for 2026, ahead of every other category.
As AI spreads through hiring, candidates trust it less, and more are committing fraud to get past it. Only 26% of candidates trust AI to evaluate them fairly, though 52% believe it already screens their application. The fraud is real: 6% of candidates admit to interview fraud, and Gartner expects one in four candidate profiles to be fake by 2028.
Uncertainty about AI in hiring also makes candidates more selective. Job-offer acceptance dropped to 51% in 2025, from 74% two years earlier.
How a staffing agency sources candidates has become a marker of performance. Referrals are now the top-converting source for 39% of agencies, but only 11% have an automated referral program, so most are running their best channel by hand.
Job boards are losing ground. Just 44% of high-growth agencies keep one in their top three sources, against 73% of slower-growth agencies. The agencies doing well rely on their own channels, especially referrals, and treat job boards as a backup.
Most staffing agencies pay workers weekly, but on-demand pay is becoming an expectation, and it is one of the clearer staffing industry trends this year. The EWA report finds that about 90% of staff say their finances improve once they can choose their own pay cycle, and 74% feel more in control of their money.
Agencies that offer daily or on-demand pay tend to keep workers longer and see better productivity. In high-turnover work like logistics and hospitality, fast pay has become a practical way to attract and keep staff.
Staffing companies continue to add services beyond placement. The Adecco Group now runs three businesses, and in 2024 its staffing arm made up about 79% of gross profit, with Akkodis (technology and engineering) at 15% and LHH (career and talent solutions) at 6%.
Common complementary services include HR consulting, outplacement, online job advertising, outsourcing, payrolling, upskilling, and workforce solutions (MSP and RPO). As remote work has grown, agencies increasingly bundle these services into staff augmentation, where the partner also handles equipment, salaries, taxes, and legal support.
How long a staffing agency takes to fill a role depends heavily on what the role is. Across all agencies in 2026, 42% fill a position in under 10 days, while 16% take more than 30. The split by specialty is wide:
Industrial and logistics
under 5 days
Healthcare
10 to 14 days
IT
15 to 19 days
Office and clerical
15 to 19 days
Engineering
20 to 24 days
Industrial and logistics roles fill fastest. IT and engineering take three to four times longer, because the AI-skills shortage has made technical talent the hardest to find. Those roles stay open the longest, and the agency that fills them fastest wins the client.
That wraps up our analysis of staffing industry trends. After three years of decline, the staffing industry returned to growth in 2026, and forecasts point to steady growth from here.
New AI tools and complementary services are changing how agencies work and where they earn. Agencies are already adapting, and the ones that adopt AI are growing the fastest. In the future, their offerings will be more flexible, across both services and payment.
Today, there are about 27,000 US staffing companies operating from 54,000 offices.
Yes. After three years of decline, US staffing revenue grew at its fastest rate in three years in early 2026, up a median 5% year over year in April. The SIA staffing forecast puts full-year US growth at about 1%.
The global average cost per hire was $2,143 in 2024. However, this varies by sector and location. For example, in design and engineering, it was $3,757 per employee. Some staffing agencies have a 0% recruiting cost and add interest on workers’ salaries.
Almost all industries use staffing services. The most prominent examples include IBM, Microsoft, Google, Amazon, Walmart, and many others.