
The trend of diversity in the workplace has become a central focus for companies around the globe. Research from McKinsey, HBR, and BCG underscores the multifaceted benefits of a diverse workforce. Specifically, businesses can enhance creativity and decision-making, improve financial performance, and get a competitive advantage in the market.
Still, what is the underlying condition behind this phenomenon? What social injustices are pushing this idea forward? Are companies adjusting their HR strategies to address the lack of diversity? Do employees from various backgrounds have the same or different experiences?
For answers, join us as we discover diversity in the workplace statistics. Read more to explore how gender, age, race, and disabilities affect the workforce.
In 2021, two-thirds of full-time employees worldwide reported that DEI programs were instrumental in creating a belonging work environment. Additionally, nearly the same percentage observed that these initiatives were key in ensuring fair compensation.
The World Economic Forum’s Future of Jobs Report 2025 shows that employers worldwide are expanding their diversity and inclusion initiatives. European and Central Asian companies lead planned implementation rates, while 96% of North American employers already have DEI measures in place.
In the United States, a 2023 survey indicated that 32% of employed adults emphasized the significance of working with people of various races and ethnicities. Being colleagues with people of varying ages was crucial for 28% of survey participants.
Looking ahead to 2025-2030, 62% of U.S. employers plan targeted recruitment and retention initiatives, 61% comprehensive DEI training, and over half will set specific diversity targets.
61% of respondents in the Philippines recognized that their companies actively incorporate diversity into their recruitment processes. Singapore showed a more modest perspective, with 34% of respondents echoing this sentiment.
In China, the accessibility of DEI programs to full-time employees seems to be more widespread than the global average. In 2021, 64% of Chinese employees had access to DEI programs at work, surpassing the global average of 41%.
Employers in Thailand plan to implement DEI programs at a rate of 64%, with 45% also planning to provide childcare support for working parents.
Looking at Europe in general, there is notable satisfaction with employers’ diversity policies, particularly within the IT and Internet software sector. On a scale from 1 to 5, employees in this sphere rated the diversity level as 3.8. The drugs and biotechnology industry was placed second, with 3.75 out of 5. Restaurant and clothing businesses are next, with 3.71 and 3.7, respectively. The sentiments contrast with the wholesale sector, where employees rated 3.51 out of 5 for their companies’ approach to diversity.
Irish employers show a strong commitment to DEI infrastructure. 73% plan to conduct pay equity reviews, 53% will establish employee resource groups, and 40% will hire dedicated DEI officers.
In the Netherlands, 64% of companies will set specific diversity goals and 46% will integrate DEI measures across their supply chains.
Norwegian employers also focus on talent expansion, with 60% planning to use diversity policies to broaden their recruitment base.
Moroccan employers prioritize youth in their DEI strategies. 86% plan to focus on youth employment as part of diversity measures, well above the global average.
South African companies target socioeconomic diversity more than global peers. 55% plan to recruit individuals from disadvantaged religious, ethnic, or racial backgrounds, and 41% plan to target individuals from low-income backgrounds. These rates exceed global averages of 27% and 24% respectively.
Recent research by WBR Insights and Traliant presents insights about DEI integration within 300 companies from across the U.S. About one-third of the respondents were from companies with 100-999 employees (32%), 1,000-4,999 employees (35%), or more than 5,000 employees (33%).
Women’s participation in the U.S. labor force has grown substantially over the past seven decades. In 1950, women comprised just 29.6% of the civilian labor force. This figure increased to 40% by 1975, 46.5% by 2000, and reached 47.1% in 2024, reflecting near parity in overall workforce participation.
However, representation varies significantly across different fields. For example, in STEM occupations, women make up only 26% of all workers. Social scientists stand out as the only STEM occupation in which women are the majority, at 61%. In contrast, computer occupations show a concerning decline from 30% women in 2000 to just 24% in 2024. Engineering remains the field with the lowest representation, at just 16% women.
These overall participation rates tell only part of the story. Below, we’ll explore how gender diversity plays out in leadership positions and examine the persistent pay gap across industries and career stages. Keep reading to explore key gender diversity in the workplace statistics!
According to the latest diversity in the workplace statistics, out of every 100 men promoted to manager, only 81 women are promoted. This number marks a decline from 87 in 2023, showing a negative trend.
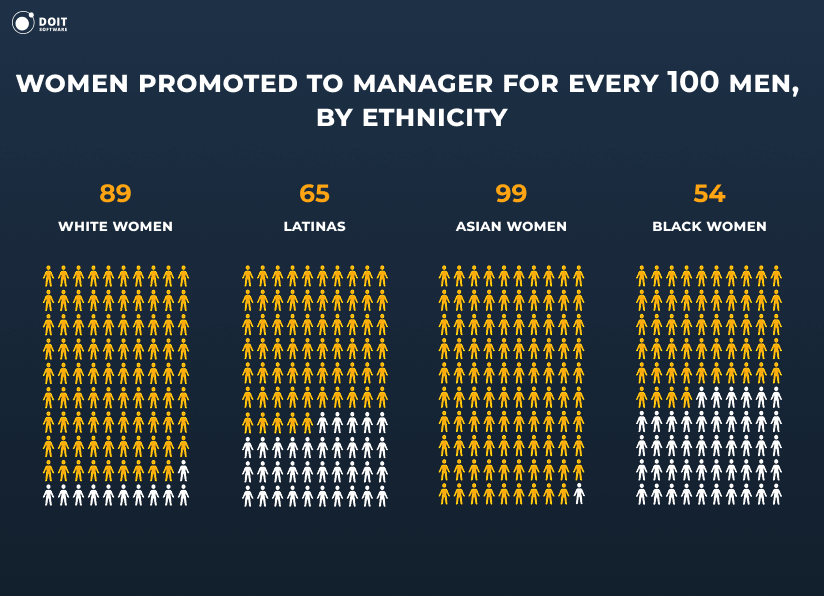
Among females, there are disparities among different ethnicities:
For the first time in 68 years, in 2023, the percentage of Fortune 500 companies led by women surpassed 10 percent, and in 2025 it reached 11%. As of January 1, 2023, there were 53 female CEOs in these top-ranking companies; by 2025, that number is up to 55.
Their businesses did not revolve around one industry. In fact, Karla R. Lewis ran Reliance Steel & Aluminum, a metal products provider. Another CEO on the list, Julia A. Sloat, led American Electric Power in the electric power industry. The last example is Jennifer A., the CEO of a motion and control technologies company Parker-Hannifin.
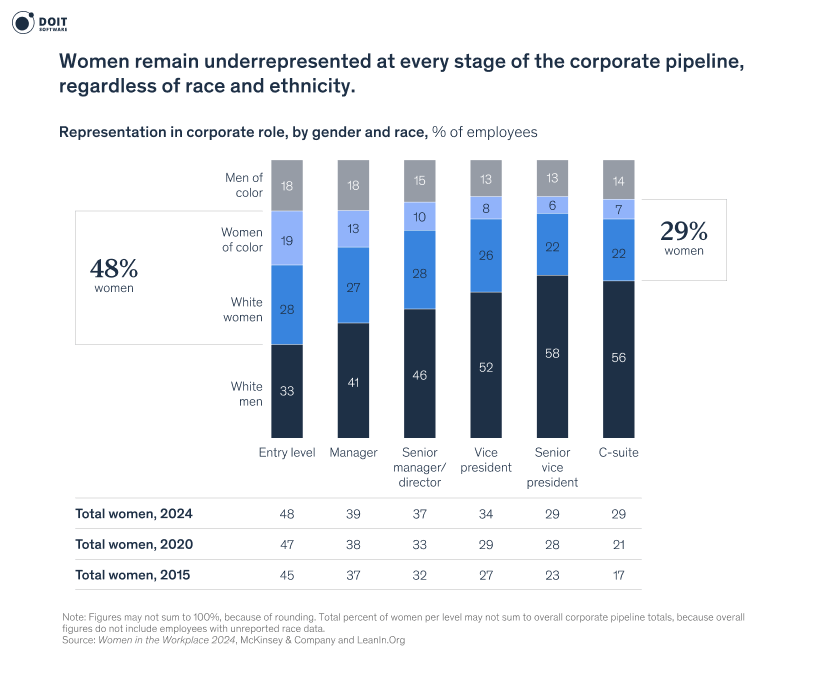
Recent diversity in the workplace statistics have shown that from 2015 to 2024, there has been a positive trend in gender inclusivity. Specifically, women’s representation in senior manager/director positions has risen from 32% to 37%. However, when it comes to the highest levels of leadership, only 3 in 10 C-suite leaders are women, and just 1 in 20 is a woman of color. The latter group, in particular, experiences a significant drop-off in representation, from 19 at the entry-level and 6 at the senior vice president level.
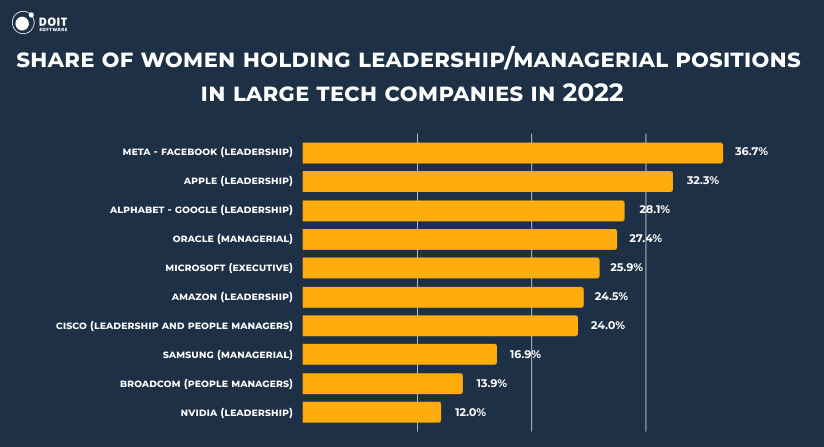
In the technology sector, women’s presence in leadership roles varies widely but has seen a surge in some companies. According to diversity in the workplace statistics, in 2022, the percentage of women in leadership positions ranged from 12% to 36.7%. Facebook led with 36.7% of its leadership roles filled by women, closely followed by Apple at 32.3%.
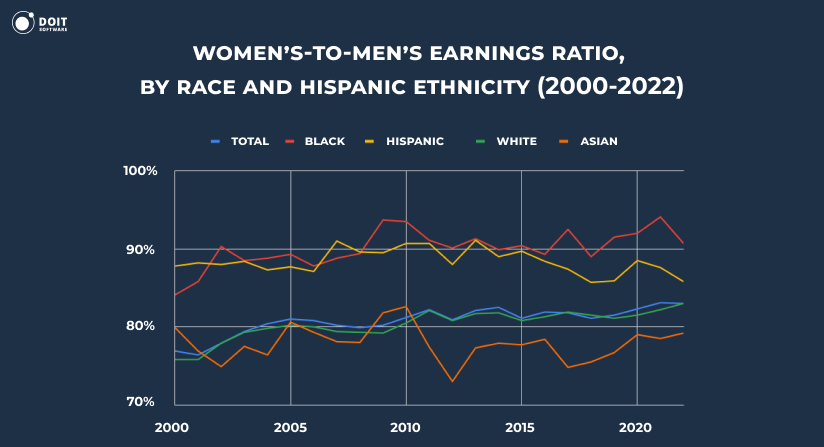
Among the challenges of diversity in the workplace, the gender pay gap is the most commonly mentioned. 2022 statistics revealed that median weekly earnings for full-time white female wage and salary workers were $958. This amount constitutes 83.0% of the median earnings for their male counterparts.
The ratios are slightly higher for Hispanic and Black women – 85.8% and 90.7%, respectively. Asian females, on the contrary, have the lowest figure – 79.2%. This disparity in pay highlights the ongoing challenges in achieving gender pay equity and reflects the broader issues of gender diversity in the workplace.
In 2023, women’s median weekly earnings rose to $1,005, representing 83.6% of the $1,202 median for men. By the fourth quarter of 2024, earnings increased to $1,083, but the ratio slightly declined to 83.2% of men’s $1,302 median.
Let’s take a look at the pay gap across different industries in 2023:
Architecture and engineering
$1,635
$1,864
87.7%
Computer and mathematical
$1,628
$1,976
82.4%
Legal occupations
$1,543
$2,301
67.1%
Management occupations
$1,483
$1,900
78.1%
Life, physical, and social sciences
$1,445
$1,658
87.2%
Business and financial operations
$1,406
$1,674
84.0%
Healthcare practitioners and technical
$1,341
$1,682
79.7%
Arts, design, entertainment, sports, and media
$1,271
$1,381
92.0%
Community and social service
$1,144
$1,157
98.9%
Education, training, and library
$1,134
$1,376
82.4%
Protective service
$884
$1,190
74.3%
Installation, maintenance, and repair
$875
$1,104
79.3%
Office and administrative support
$864
$983
87.9%
Sales and related
$830
$1,196
69.4%
Community and social service occupations showed the smallest women-to-men pay gap at 98.9%, while legal occupations had the largest disparity at 67.1%. Women in legal professions earn just over two-thirds of what their male counterparts make.
When it comes to specific roles, the pattern becomes even more striking. The gap tends to widen in higher-paying occupations. Other financial specialists show the largest disparity at 51.7%, with women earning $1,233 compared to men’s $2,386. Medical scientists face a similar gap at 67.1%. Securities, commodities, and financial services sales agents also show a substantial difference at 68.6%, with women at $1,654 versus men at $2,412.
On the flip side, some occupations show near parity or even favor women. Producers and directors lead with women earning 122.6% of men’s wages. Production, planning, and expediting clerks are virtually equal at 99.9%, while physicians (in certain specialties) reach 99.6%. Social and human service assistants also demonstrate near parity at 99.5%.
Now, let’s consider gender diversity in workplace statistics by age group as of Q4 2024:
16 years and over
$1,083
$1,302
83.2%
16 to 24 years
$721
$796
90.6%
25 to 34 years
$1,062
$1,187
89.5%
35 to 44 years
$1,205
$1,488
81.0%
45 to 54 years
$1,193
$1,468
81.3%
55 to 64 years
$1,097
$1,442
76.1%
65 years and over
$1,055
$1,313
80.4%
Gen Z women (16-24 years) entering the workforce face the smallest pay gap at 90.6%. However, the disparity grows significantly as careers progress.
Women aged 25-34 see the gap widen to 89.5%, while those in their late thirties and early forties (35-44) experience a decline to 81.0%. Gen X women (45-54) face a similar 81.3% ratio. Workers aged 55-64 see the largest gap at just 76.1%, losing nearly a quarter of their male peers’ earnings.
Heterogeneous leadership has a tangible impact on the acceptance and implementation of new ideas. HBR’s diversity in the workplace statistics indicate that without a varied leadership team, the likelihood of different groups getting their ideas endorsed sees a notable decline:
As you can see, at the highest levels of decision-making, diverse perspectives are important. They play a major role not only in equity but also in the breadth of ideas and innovation within an organization.
The perception of workplace diversity varies significantly across generations. In 2021, only 35% of employees from the Boomer generation viewed their workplace as very or extremely diverse. In contrast, a majority of younger generations — 51% of Gen Z or Millennial employees — regarded their workplace as diverse. This generational divide highlights different experiences and expectations regarding diversity in the workplace.
Millennials have a strong belief in the connection between inclusive cultures and innovation. According to diversity in the workplace statistics, 74% of millennial employees feel that their organization is more innovative when it fosters a culture of inclusion. Furthermore, nearly half of the millennials consider diversity and inclusion an important factor when evaluating potential employers. This sentiment emphasizes the growing importance among younger workers for diverse and inclusive work environments.
In 2023, Deloitte’s extensive survey of over 22,000 Gen Z and millennial respondents revealed a critical gaze toward employers’ societal impacts, including DEI efforts.
While there was some recognition of progress, less than half of these younger generations believed businesses were making a positive influence. Gen Zs were slightly more optimistic than millennials, with 48% believing in the positive role of businesses compared to 44% of millennials.
As more than 50% of responders did not feel the beneficial impact, the reason might lie in their experiences of harassment. More than 60% of Gen Zs and around 50% of millennials encountered microaggressions in the past year. Reports of inappropriate emails, unwanted physical contact, and exclusionary behavior were prevalent. Despite high reporting rates, many believed their employers’ responses were ineffective, particularly among women, non-binary, and LGBT+ groups.
The 2025 version of the same survey shows these workplace challenges persist and reveals deeper patterns. Among those who say their job causes stress, 44% of Gen Zs and 45% of millennials cite toxic culture at their workplace. 44% of both generations report not feeling that decisions at work are made fairly. Moreover, 36% of Gen Zs and 33% of millennials say they don’t feel included by their colleagues.
There’s a notable gap between expectations and reality when it comes to managerial support for inclusion. While 42% of Gen Zs and 41% of millennials believe managers have a responsibility to foster a positive and inclusive work culture, only 22% of Gen Zs and 21% of millennials say this is actually happening.
In the United States, the view on diversity initiatives is mostly positive among racial groups. A 2023 survey highlighted that a significant 78% of black-employed adults see the push for increased DEI in the workplace as positive. Contrastingly, less than half of White employed adults, at 47%, share this viewpoint. Hispanic and Asia workers have 65% and 72%, respectively.
Among those who believe diversity efforts to be negative, white adults have the biggest share – 21%. Meanwhile, only 1% of black respondents have the same thoughts. Asians and Hispanics have 10% and 9%, respectively.
As of August 2025, diversity in the workplace statistics reveal that whites are the majority of the U.S. labor force
75.6%, a slight decline from 77% in 2022. Blacks and Asians make up an additional 13% and 7%, respectively. Hispanic or Latino individuals, who may identify with any race, account for 18.7% of the labor force, down slightly from 19% in 2022.
When it comes to the employment-population ratios, the August 2025 data shows Hispanic or Latino individuals reporting the highest rate at 63.8%. Asian workers maintain a strong ratio at 62.7%, White workers show 59.5%, and Black or African American workers report 57.9%.
Here’s the breakdown of employment-population ratios across major racial and ethnic groups:
Hispanic or Latino
63.5%
63.8%
+0.3%
Asian
62.7%
62.7%
-
White
60%
59.5%
-0.5%
Black or African American
58.4%
57.9%
-0.5%
Diversity in the workplace statistics indicate that men in the largest race and ethnicity groups show varying employment-population ratios. Specifically, Hispanic men are at the highest (76.9%), and Black men are at the lowest (63.9%).
Among women, these ratios show less variation yet still reflect disparities across racial and ethnic groups. For instance, black women show a 58.6% rate, Hispanic women 57.3%, Asian women 56.9%, and White women 55.5%.
Teen employment also shows differences. White teens have a higher employment-population ratio (35.5%). In contrast, Asian teens have 22%, Black teens 24.6%, and Hispanic teens have 29.3%.
Based on diversity in the workplace statistics, only six Black CEOs were leading Fortune 500 companies in 2022. By 2025, this number increased to eight. This figure stands in stark contrast to the entrepreneurial spirit among Black Americans, evidenced by over 134,000 Black-owned businesses nationwide. These companies collectively employ approximately 1.3 million people and generate over $133 billion in total receipts.
A comprehensive Gallup survey revealed that Black and Hispanic workers report discrimination more frequently than their White counterparts. Notably, 27% of Black men and 23% of Black women have reported experiencing workplace discrimination, with minimal variation across income levels. On the other hand, a lesser share – 15% – of white individuals have faced the same problem.
A significant 75% of these Black workers attributed the discrimination to their race. In comparison, 61% of Hispanic and 42% of white employees report the same issue.
The 2025 Pew Research survey shows that Americans broadly recognize discrimination against racial and ethnic minorities exists in society. When asked about how much discrimination different groups face:
Racial bias is present prior to employment as well. According to diversity in the workplace statistics, distinctly Black names lower the chance of employer contact by 2.1% compared to white-sounding names. Interestingly, this racial bias varies significantly between companies and was negatively associated with firm profitability and federal contractor status. Notably, the top quintile of companies responsible for discriminatory practices accounted for nearly half of the reduced contact rates for Black applicants.
You are about to explore diversity in the workplace statistics on employees with disabilities hiring, as well as on financial and operational outcomes.
Stay with us!
The paid employment rate for people with severe disabilities in Germany was notably low – at only 4.61%.
According to Statista’s diversity in the workplace statistics, 172,484 people (11.5% of the general population) with severe disabilities were unemployed. Nearly half (46.52%) of them were not working on a long-term basis.
Furthermore, 74.2% of employers fulfilled at least one mandatory job position for people with severe disabilities. Yet, only 39.5% filled all the compulsory positions, suggesting room for improvement in diversity hiring practices.
In the United States, there was a positive trend in 2024, as the employment-population ratio for persons with disabilities rose to 22.7%, the highest since 2008. The number represents a steady climb from 21.3% in 2022 and 22.5% in 2023. Despite this increase, people with disabilities were still less likely to be employed compared to those without.
Notably, individuals with disabilities found more opportunities in service, production, transportation, and sales and office jobs than those without disabilities. The occupation breakdown for workers with disabilities showed:
Compared to workers without disabilities, those with disabilities were more likely to work in sales and office roles (20.8% vs. 18.4%) and service positions (19.0% vs. 16.3%).
The data also highlighted that 9.2% of workers with disabilities chose self-employment, a higher rate than their non-disabled counterparts. This trend could point to an entrepreneurial spirit or a need for more accommodating work environments.
Let’s compare employment diversity in the workplace statistics regarding people with disabilities vs those without.
Employment-population ratio
22.7%
65.5%
Unemployment rate
7.5%
3.8%
Self-employment rate
9.2%
6%
Part-time employment
31%
17%
These insights into the workforce diversity statistics reveal that there has been progress in the employment of people with disabilities. However, a need for more inclusive hiring and retention practices still remains. Both German and U.S. statistics serve as a call to action for diversity in the workplace, especially for the most diverse companies to lead by example and for all employers to reassess and improve their diversity and inclusion strategies.
Workplace diversity statistics in Asia Pacific reflect a more critical disparity. With 690 million people living with a disability, and 472 million of working age, their participation in the workforce is low. Many are relegated to informal work without social benefits, and significant barriers remain for women, certain disability groups, and rural inhabitants.
Historically, employers have viewed the responsibility for employing persons with disabilities as a government or charity matter. The reason often lies in concerns about productivity, safety, and accommodation costs.
However, the assumptions that people with disabilities can only perform routine jobs or that workplace adaptations are prohibitively expensive have been proven incorrect. Businesses that have embraced disability-inclusive practices have debunked these myths, contributing positively to global diversity statistics.
Global Consumer Report highlighted workers’ preferences for job qualities in 2022. Flexible schedules or remote options, along with good pay and benefits, ranked first at 53% and 50%, respectively. Meanwhile, a diverse and inclusive environment is considered an ideal quality by 12% out of 11,000 workers. This relatively lower percentage might suggest that these criteria were not the primary drivers in the job selection process for the majority of the workforce.
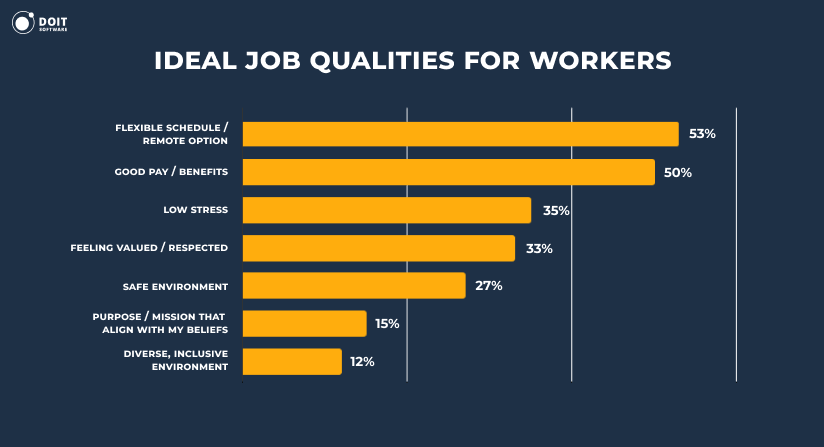
This relatively lower percentage might suggest that these criteria are not the primary drivers in the job selection process for the majority of the workforce. For those evaluating job offers, understanding compensation components such as stock options vs RSUs can also be crucial. These equity incentives play a significant role in overall job satisfaction and long-term financial planning.
However, this data contrasts with Glassdoor’s diversity in the workplace statistics.
According to Glassdoor’s survey in September 2022, among job seekers and workers aged 18-34, 80% considered a company’s commitment to DEI as very or somewhat crucial when looking for a new job. This percentage was notably higher compared to those aged 55-64 (67%) and over 65 (61%). Even among the 35-54 age group, the value placed on these factors is slightly less, at 74%.
When considering gender differences, 76% of women, compared to 72% of men, found these aspects noteworthy in a company. In terms of race and ethnicity, Black (79%), Hispanic (77%), and Asian American/Pacific Islander (AAPI, 82%) job seekers and employees placed more importance on these factors than their white counterparts (71%).
This data highlights a clear message: While not always the top-listed job selection criteria, DEI is still taken into consideration, especially among minority groups.
Companies prioritizing gender diversity in executive teams see remarkable financial gains. For instance, workforce diversity statistics highlight that companies with higher gender diversity scores were 25% more likely to achieve above-average profitability in 2019, an increase from 21% in 2017. When over 30% of executives are women, these companies often outshine their peers, where this figure is lower. The most diverse companies showcase a 48% likelihood of outperformance over businesses with minimal gender diversity.
The racial diversity in the workplace is also a strong performance indicator. In 2019, companies with the most ethnic and cultural diversity outperformed the least heterogeneous by 36% in terms of profitability. This indicates a consistent trend where diversity in the workplace directly correlates with financial success.
Leaders who have diverse inherent (e.g., ethnicity and gender) and acquired (e.g., cultural difference) traits are running more innovative companies. These organizations are 45% more likely to report an increase in market share and 70% more likely to enter a new market. Moreover, their business decisions improved by 60%. Such teams are twice as likely to meet or exceed operational expectations.
The diversity hiring statistics from FCLTGlobal’s research show that companies with the most diverse boards enjoyed a 3.3% increase in return on invested capital (ROIC) over their less diverse counterparts. Specifically, gender-diverse boards saw a 2.6% higher ROIC, illustrating the value of diversity in the workplace.
Also, diversity organizations see a cash flow that is 2.3 times greater per employee over three years. For smaller companies, the revenue stream was 13 times higher. Such inclusive and well-managed businesses are also 1.8 times more likely to be ready for change and have 1.7 times greater chances of leading in innovation.
Coaching for performance, dealing with performance problems, and building leaders are areas where these businesses excel, with likelihoods of 3.8, 3.6, and 2.9 times higher, respectively. These statistics underscore the importance of diversity in the workplace and its direct connection to organizational agility and leadership development.
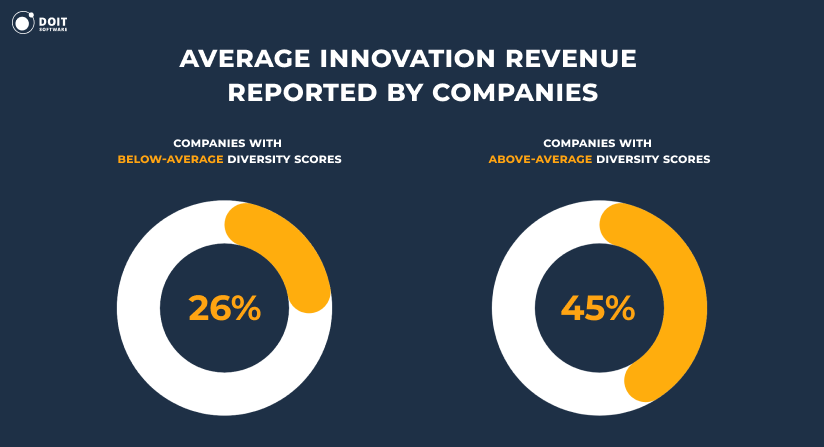
According to a BCG survey, businesses with above-average diversity hire report that 45% of their revenue comes from innovation. In comparison, companies with below-average scores have a lower percentage – 26% only. This gap suggests that diversity in the workplace statistics correlate with higher innovation.
The pandemic has had a disproportionate impact on women in the workforce. In fact, females’ jobs are 1.8 times more vulnerable to the current crisis than males’. Although women represent 39% of global employment, they account for 54% of total job losses. The increase in unpaid care burdens, mainly shouldered by women, is a significant factor. If no measures are taken to address this lack of diversity, we could see a $1 trillion decrease in global GDP by 2030. However, if gender parity is achieved, there’s a potential to boost global GDP by $13 trillion, indicating the profound economic benefits of diversity in the workplace.
The above-mentioned facts about diversity in the workplace demonstrate the need for inclusive environments. Employees are looking for companies that support such dynamics through tangible actions and policies. The push for diversity is especially pronounced among job seekers from underrepresented groups.
By the year 2028, there might be changes in employee demographics. To be more specific, it is anticipated that minorities will constitute more than a third of the labor market. It is forecasted that the Hispanic demographic will experience the most significant increase. Asian and Black workers’ representation is also projected to surge substantially.
One of the emerging workplace diversity trends is the establishment of clear and open DEI measures. The statistics suggest a future where diversity is the norm, serving as a driver of growth.
Transform your idea into a successful product with the DOIT Software team.
CONTACT USStatistics on diversity in the workplace vary globally. For example, in the U.S., women make up about 48% of the workforce, yet only 29% reach the C-suite level. In terms of racial diversity in workplace, Black and Latin individuals hold fewer managerial positions compared to their white counterparts. Specific numbers can be found in our detailed analysis of the current diversity landscape.
Yes, according to the Harvard Business Review, companies with diverse teams are indeed 70% more likely to capture new markets. This is attributed to the wide range of perspectives and ideas that a diverse team brings, enabling the company to better understand and adapt to new market demands.
The diversity trend in 2025 shows a concerning disconnect between effort and results. While over 80% of companies in leading regions are implementing targeted recruitment and training programs, progress in key metrics is slowing or reversing.
Women’s promotion rates dropped from 87 per 100 men in 2023 to just 81 in 2025, and the gender pay gap barely moved from 83.6% to 83.2%. Women still hold only 3 in 10 C-suite positions, and just 8 Black CEOs lead Fortune 500 companies. Disability employment shows the most consistent progress, rising from 21.3% in 2022 to 22.7% in 2024, though unemployment rates remain twice as high for this group.
Diversity drives innovation, enhances decision-making, and reflects the multi-faceted makeup of the global customer base. It also contributes to a more equitable and just society by providing equal opportunities for all.